

FRONTLINE
GIS
SOLUTIONS
The project
The pandemic, COVID-19 has brought about new challenges that need to be attended to for the betterment of the world. Our project’s purpose as Frontline GIS Solutions is aimed at bringing forth detailed and analysed geospatial information on healthcare facilities available in the informal settlements of Mamelodi in Pretoria, South Africa. This information is meant to provide clarity to our client, The Department of Health in South Africa, in terms of the distribution weighting of COVID-19 vaccines to the various healthcare facilities. The objectives of this project will be reached by gathering data on the healthcare facilities preparedness in administering the vaccine, which include the capacity of health care providers together with their surrounding infrastructure information. This data will be retrieved from the healthcare facilities in Mamelodi, Tshwane municipality and from all open data available.
The proposed solution
As a consultant for the Department of Health in South Africa, the primary goal of this project is to evaluate the positioning of the current medical infrastructure in the Mamelodi Area. This is a necessary step in planning for the distribution of the COVID-19 vaccine. After evaluation, authorities will have a quality solution, which can assist with the decision making on how to distribute resources associated with the vaccine response.This vital information will be accomplished through the process as explained below.
Firstly, the catchment area for each medical facility will be modelled, this will take into account the transport network which would have an effect on the magnitude of the catchment area. Then, each catchment area will be evaluated according to the demographics of that area using the available census data. This will give an indication of how well positioned the medical facility is.
Finally, the medical facilities in the Mamelodi area will be ranked according to their positioning and the size of their catchment area. This will support decision making with regard to the distribution of COVID-19 vaccinations. Facilities which service larger areas and a greater magnitude of the population should be prioritized when resources are distributed, as this will ensure that medical facilities are supported in a way that is proportional to the support they provide to their individual catchment areas.
The stack
Stack diagram
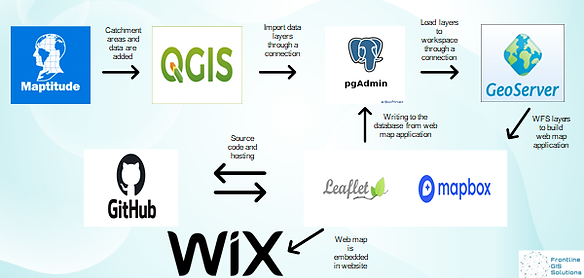
Stack description
In the creation of our web mapping application we used five open source software namely Quantum GIS (QGIS), PgAdmin, GeoServer, Leaflet and Map box and one licensed software called Maptitude.
Our health site catchment areas were created using Maptitude, the catchment areas and shapefile data were added to QGIS as vector layers. A connection between QGIS and PgAdmin was made to import the layers into our database in PgAdmin. The layers were added to our workspace in GeoServer through a connection created between PgAdmin and GeoServer. Our web map application was built using Leaflet, Mapbox and the Web Feature Service (WFS) from GeoServer. The communication between the web map application and PgAdmin database is done using php.
All the code that has been used can be found on our GitHub repository and our web map application is embedded in our website.